User Guide
Snapshot
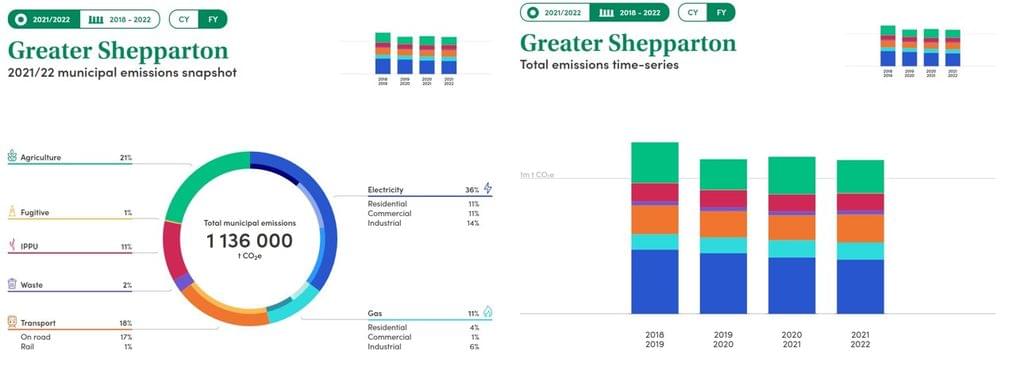
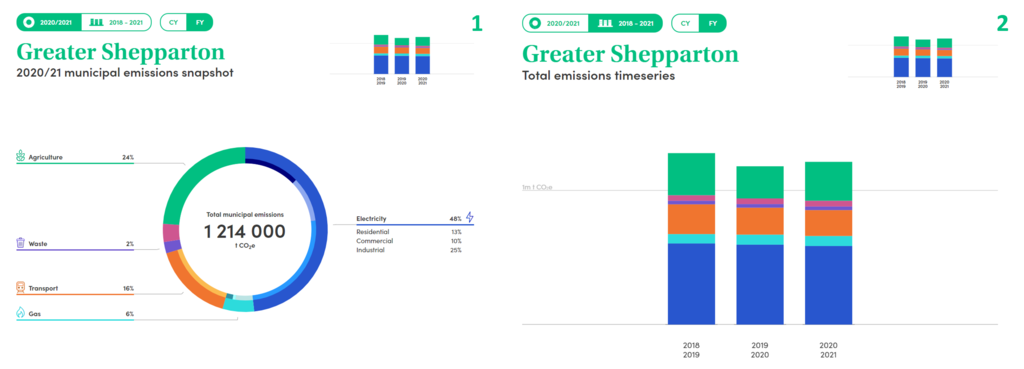
Snapshot Climate shows local emissions profiles for all Australian municipalities, federal electorates and states. It is designed to help you identify sources of these emissions and the most effective strategies to reduce them. The free Snapshot profiles are updated annually.
Each Snapshot profile gives a breakdown of emissions by sector and sub-sector, including stationary energy (electricity and gas), transport, agriculture and land use, waste, fugitive emissions and industrial processes and product use (IPPU). To see what each sector of emissions accounts for please see the FAQs for the relevant sector.
The data is represented as the total emissions in carbon dioxide equivalent (tCO2e) by emissions source and sector. This is the universal unit of measurement for greenhouse gas emissions, as it takes into account the global warming potential of each greenhouse gas expressed in terms of one unit of carbon dioxide. It is used to evaluate the climate impact of releasing (or avoiding releasing) different greenhouse gases with a common basis. Due to the approximate nature of the profile, the emission values are represented as rounded numbers.
Snapshot is generated from locally sourced activity data (Tier 2) where available, and national or state level data in all other cases (Tier 1). The methodology is compliant with the Global Protocol for Greenhouse Gasses.
Snapshot can be used alongside local data sets where more detail is needed. The full methodology and data sources are available to download from the Resources page.
Alongside the data available online, you can download:
- A PDF report which provides the profile chart and a high-level written summary.
- Snapshot data in CSV format to use in your own analysis.
- An image of the profile chart (PNG)
- An image of the profile data table (PNG)
How to explore Snapshot
Snapshot currently provides profiles for the following calendar and financial years for all Australian municipalities, federal electorates and states:
Calendar years: 2018, 2019, 2020, 2021, 2022
Financial years: 2018/19, 2019/20, 2020/21, 2021/2022, 2022/2023
For your selected region, for example, the municipality of Greater Shepparton, you can navigate between the following four views to explore the data for each year.
1. Profile Home. This shows the emissions profile for the latest year. Use the bar chart in the top right to navigate between different profile years. Toggle between financial and calendar years using the CY/FY button.
2. Time-series. Toggle to the time-series view using button in the top left. Click on individual bars to see the Profile Home view for that year.
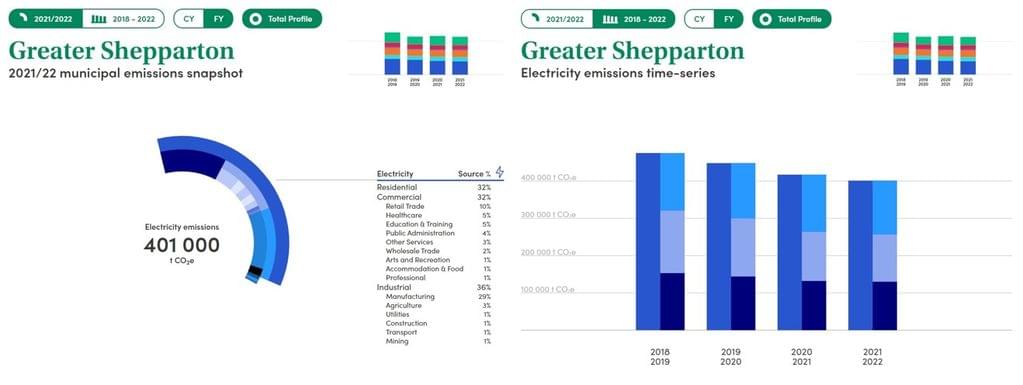
3. Sub-sector Breakdown. Hover over the profile donut and click on a wedge to view a more detailed breakdown of emissions by sub-sector.
4. Sub-sector Time-series. When you are in the Sub-sector Breakdown view, you can toggle to the Sub-sector Time-series view using the button in the top left. Toggle between financial and calendar years using the CY/FY button.
Watch the Snapshot Virtual Tour to see how to navigate your profile.
How to use this data
Communities and councils have a strong and proud history of leading climate action and many are working towards 100% renewable energy goals and ambitious zero emissions targets. With an understanding of the largest emissions sectors in your local area, you can target your activities to high impact areas.
Snapshot can help you identify climate activities in your community:
Building awareness: Share your Snapshot emissions profile with your community and council on social media.
Advocating for next steps: Use Snapshot to advocate with your elected representatives, council and community. This could include setting a community-wide target or obtaining council support or endorsement. You can use this report to secure funding to employ a staff member to lead this work, or to develop local climate action plans.
Targeted project: Select a project based on the sectors that are likely to generate the highest emissions in your community. For example, if transport makes up a significant proportion of emissions, it might present a good target area, whereas if waste is estimated at only 3% of emissions you know the emissions impacts of your project, no matter how successful, will be limited.
Reporting: Snapshot emissions profiles are fully compliant and compatible with the Global Covenant of Mayors (GCoM) and the Carbon Disclosure Project (CDP) reporting requirements. To use Snapshot data to report to GCoM or CDP please fill in the expression of interest form.
Developing the tool: Join us in building this tool by providing feedback and suggestions on how the tool could add further value and support climate change action.
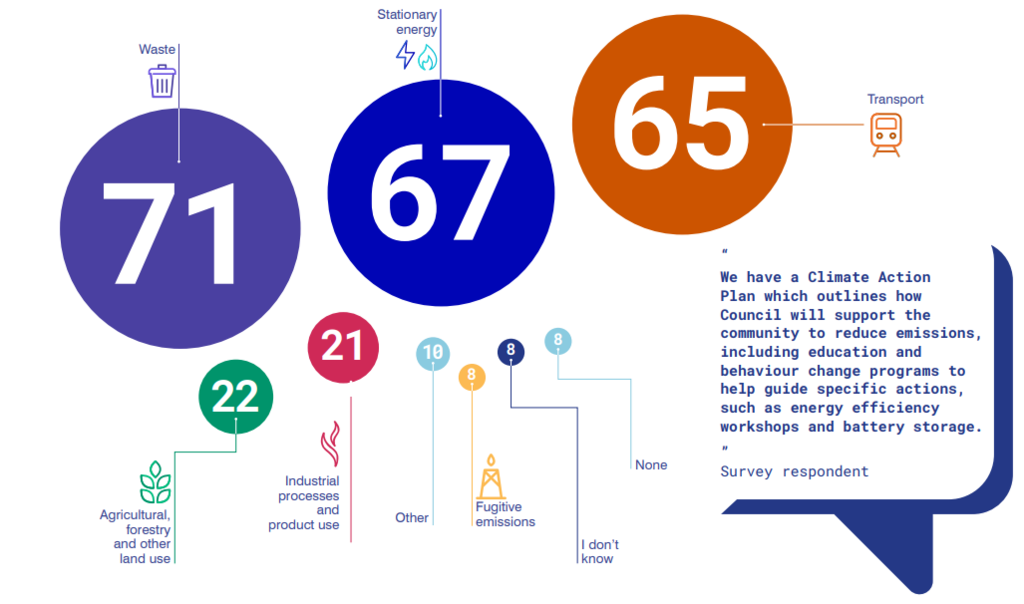
The following infographic from the 2024 Local Government Climate Review illustrates the proportion of councils in 2024 taking simple community wide actions to reduce greenhouse gasses in their area. Please read the Resources page for further ideas and information.
Use of this website governed by the terms of use set out in our Privacy Statement.