Download
Please note that Snapshot CSV downloads are not directly compatible with CDP reporting. For a CDP compatible version please contact hello@snapshotclimate.com.au.
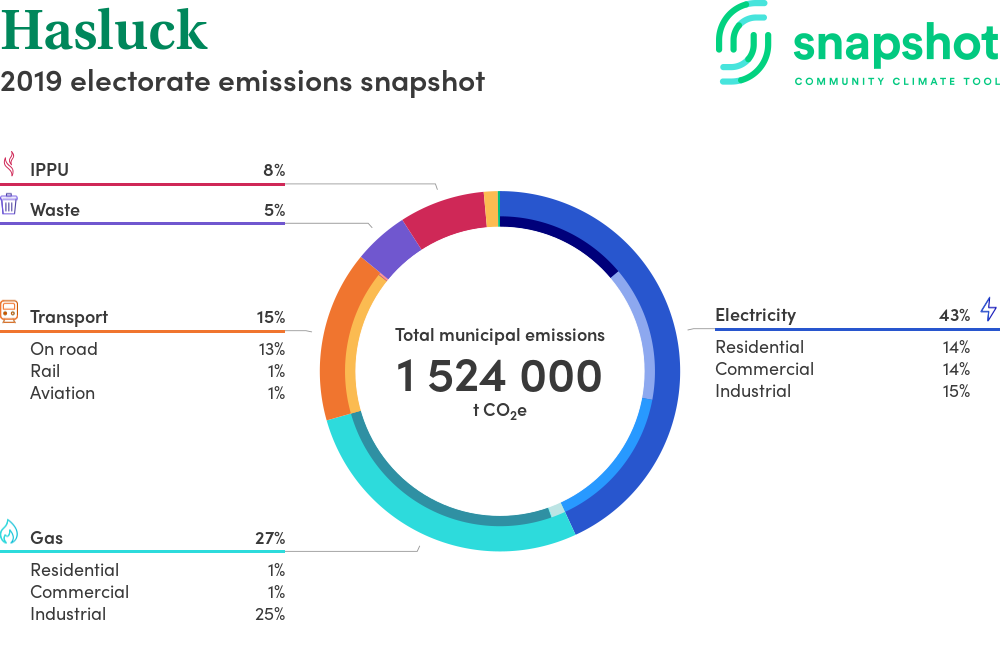
Hasluck is a federal electorate that is moderate in size relative to the state average and has a low urban density. Its major emissions source is electricity consumption, due to the state’s scale of population and commercial activity. The second largest source of emissions is gas consumption.
There are many reasons why a profile can change over time including changes in emissions sources, updates to methodology and more accurate data sources. Read our FAQs for more information.
Sub-sector data gives a better understanding of the key stakeholders contributing to emissions within your profile.
Sub-sector breakdowns can be used to identify opportunities for engagement and collaboration with key emitters. There are also opportunities for inspiration and learning with regions which have the same high emitting sectors. For more information on what is included within each emissions source and sector, please see the FAQs.
The Snapshot time-series gives an overview of high-level emissions trends. Visible trends might include the impact of continual decarbonisation of the electricity grid, or the impact of Covid-19 lockdowns on transport emissions.
Because the data is partially modelled, the Snapshot time series is not suitable for detailed tracking of emissions reductions or for tracking the impacts of specific programs. As the quality of available data continues to improve, so will the tracking capabilities of Snapshot in the future.
The Snapshot sub-sector breakdown time-series gives an overview of high-level emissions trends. Visible trends might include the impact of continual decarbonisation of the electricity grid, or the impact of Covid-19 lockdowns on transport emissions.
Because the data is partially modelled, the Snapshot time series is not suitable for detailed tracking of emissions reductions or for tracking the impacts of specific programs. As the quality of available data continues to improve, so will the tracking capabilities of Snapshot in the future.
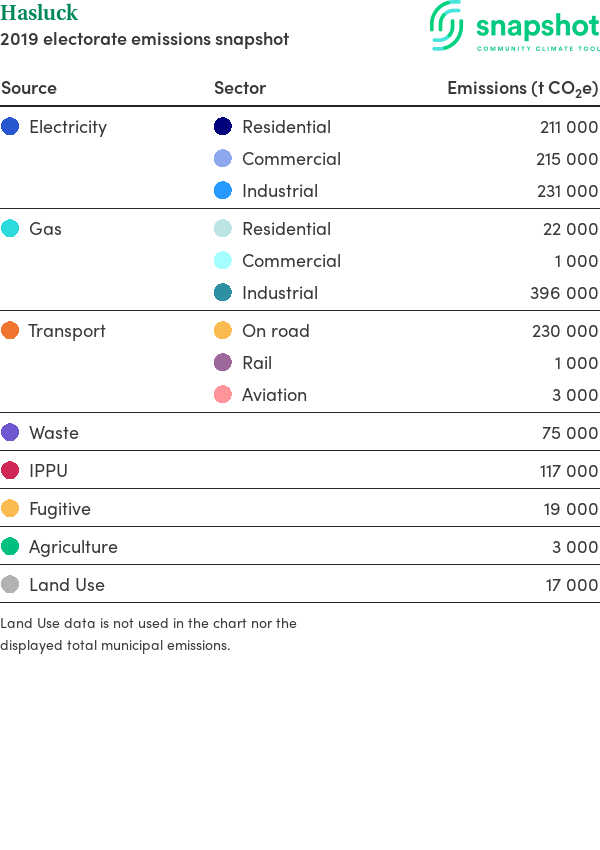
| Source | SectorEmissions (t CO2e) | |
|---|---|---|
| Electricity | Residential | 211 000 |
| Commercial | 215 000 | |
| Industrial | 338 000 | |
| Gas | Residential | 22 000 |
| Commercial | 2 000 | |
| Industrial | 395 000 | |
| Transport | On road | 340 000 |
| Rail | 1 000 | |
| Aviation | 3 000 | |
| Waste | 74 000 | |
| IPPU | 110 000 | |
| Fugitive | 18 000 | |
| Agriculture | 3 000 | |
| Land Use | 19 000 | |
Land Use data is not used in the chart nor the displayed total municipal emissions.
| Characteristics | |
|---|---|
| Land area | 1 201 km2 |
| Population | 146 520 |
| Gross regional product | $ 7 115 275 000 |
| Climate zone | 4 |
This report outlines the major sources of carbon emissions for the entire region (municipality, electorate, or state). Due to the approximate nature of the profile, the emission values are represented as rounded numbers. This report includes the following sources:
It has been developed to be consistent with the Global Protocol of Carbon Emissions reporting (GPC Protocol) BASIC+, the international standard for cities and local government areas.
Snapshot provides you with a profile of your region’s emissions for the inventory year noted and gives a breakdown of emissions by sector. This Snapshot of your greenhouse gas emissions profile is based on a combination of local (Tier 2) and state level (Tier 1) data sets. Snapshot can be used alongside other local data sets where more detail is needed.
There are a number of minor emissions sources that are included as part of a larger total or excluded. The full list of inclusions and exclusions can be found in the Methodology document.
You can download a PDF copy of this report optimised for printing and sharing.
Use of this website governed by the terms of use set out in our Privacy Statement.